
Decades: Investing for the Long Term
With a new decade on our hands, it's time to zoom out and take a look at the big picture. I was so busy last month, it didn't even occur to me that we were on the verge of a new decade until I saw people posting about it on Facebook. Now that I'm in reflection mode, I'm wondering about the significance in the ending of one decade and the start of another. In the 1980's I was a little kid, and in the 1990's I was a teenager. I graduated college and moved to Austin just after the millennium, thus beginning my adult life.
I became a parent and business owner in the early 2010's, and that gets us up to the present. Looking at my life this way, it seemed funny to think about how big the differences were between those life chapters. In between, there were a lot of noisy moments and decisions that seemed big at the time. What classes to take in college? Which car to buy? What school to enroll my kids in? But compared to the difference between being a teenager and being a mom, the differences between the options I had for those smaller decisions don't seem quite so dramatic.
Sometimes it's good to zoom way out to get a different view from how things look day-to-day. Which leads me to my favorite kinds of charts -- the long term ones.
The S&P 500 by decade
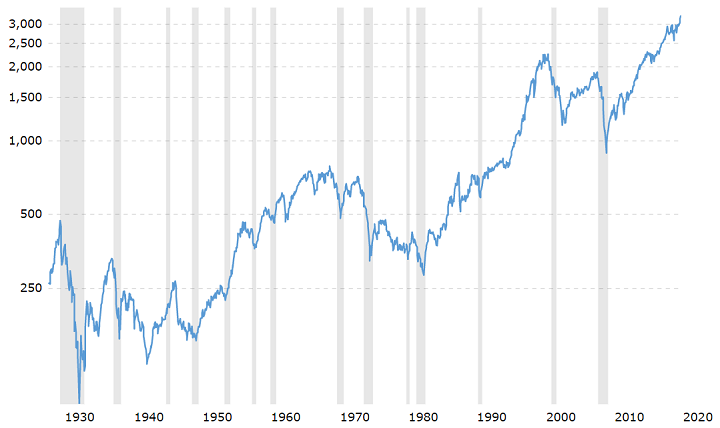
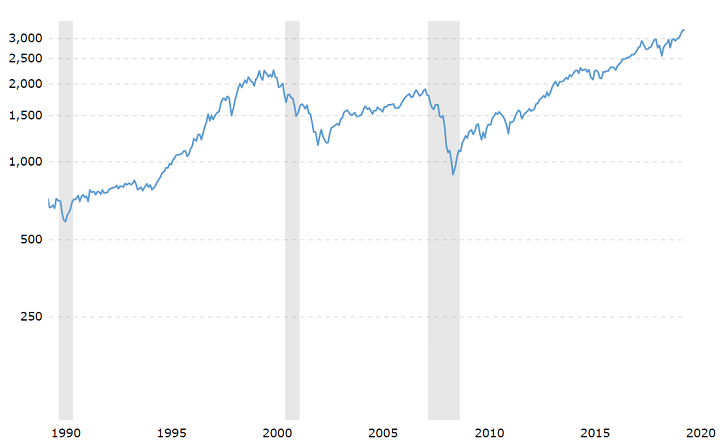
The chart above shows almost a century of the S&P 500. We see lots of zig-zags and some extended slumps, but overall, a general upward trend. Now let's take a closer look at the last 30 years for a more recent big-picture view:
https://www.macrotrends.net/2324/sp-500-historical-chart-data
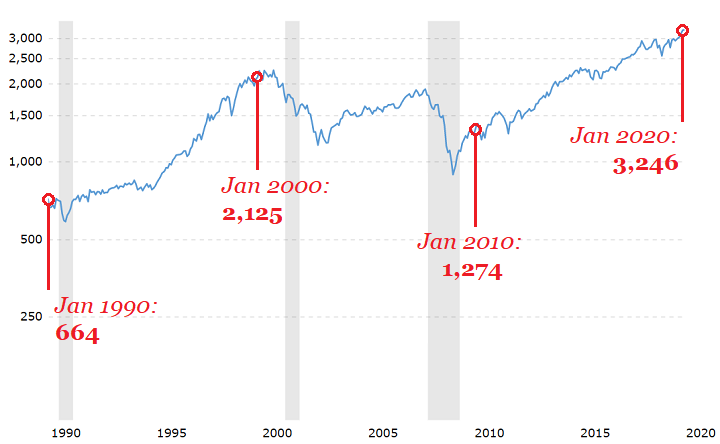
The vertical gray stripes indicate periods of recession. The first one is around 1990-91 and it led to George HW Bush being voted out of office. The second is basically the dot-com bubble bursting, compounded by 9/11. The third one is the Great Recession. Let's find the value of the index at the start of each decade. The S&P took a dip at the beginning of the 1990's but then rocketed up more than 200% by the end of the decade. The 2000's saw the index take two major hits, cutting its value in half at the low-point of the Great Recession. By the beginning of the 2010's the recovery had begun, and it's been chugging up ever since.
So the big picture is... over the last 30 years the S&P increased in value by 389%.There were some massive swings within each decade, but the overall takeaway is that long-term investing in the S&P paid off.
Deciding which investments to make and when to make changes are tough decisions. But they're not nearly as important as whether you are saving and investing and whether you stay invested for the long term. It's not easy when the markets take a dive, but sticking with your investing plan through thick and thin - while making the necessary adjustments - is the only way to gain the benefits of compounding. And that's how you see real growth in your portfolio over the long term.