Volatility and the Iran Conflict: Putting a Strategy in Place
With the Nasdaq in correction territory (down over 10% from its most recent peak) and Brent crude oil prices at $112/barrel as of last Friday, March 27, 2026, it’s normal to feel "headline fatigue" from the fluctuations at the gas pump and the conflict in Iran. We are experiencing the turbulence with you.
In my opinion, the best antidote to uncertainty is a clear, simple plan. Our core strategy is to divide your portfolio: Carve out cash for today, and maintain a stock allocation for 10 years from now. That way, it’s possible to be both a short-term realist and a long-term optimist - protecting your current self and your future self.
Short-term Security: Cash and Cash-Like Options for 2026
As we know, today’s volatility is driven by a global energy shock and the uncertainty of war. It is completely rational that in times of geopolitical conflict, you want a "safety blanket" to provide stability and peace of mind.
To determine the size of your safety blanket, ask yourself:
How much cash do you need for near-term expenses, including higher energy costs?
How much do you want in your emergency fund to feel truly secure?
How much "sleep-at-night" cash do you need to tune out the headlines?
This amount should be set aside in cash or cash-like investments. Cash remains the ultimate stable asset. If held in an FDIC-insured account, your principal is protected regardless of Middle East headlines.
Interest Rates for Your Safety Blanket Assets
Even as markets struggle, the "price" of waiting on the sidelines remains pretty attractive (as of March 27, 2026):
High-Yield Savings: Online banks are offering up to 3.65% APY (like Marcus), with savings accounts that are FDIC insured.
Money Market Funds: Ultra-safe funds like Schwab’s Prime Value (SWVXX) and Fidelity’s Government Money Fund (SPAXX) are offering 7 day yields from 3.47 - 3.56%. We use these for Black Barn clients within their managed accounts. They offer next-day liquidity but are not FDIC insured.
Series I Savings Bonds (I Bonds): A vital tool against the inflationary "double-whammy" of rising oil prices, I Bonds currently yield 4.03% for bonds issued through April 30, 2026 and include an inflation adjustment. While they protect against future high inflation, investment is capped at $10,000 per person per year and requires a 12-month commitment.
CDs and Treasuries: 1-year FDIC-insured CDs currently yield 3.9%, and liquid 1-year U.S. Treasuries currently yield 3.895%. USTs are very liquid, just in case you end up needing cash before the maturity date.
Keep in mind that rates fluctuate daily; however, holding a CD or Treasury bond to maturity guarantees the quoted interest.
What about gold?
While it may be appealing for other reasons, I don’t consider gold a true “safety blanket” asset. Over the last three months, gold (blue mountain chart) has been up 18%, down 13.5%, up 15%, and down 15.5% - a path that has been anything but stable when compared to the Schwab Money Market (pink sideways line).
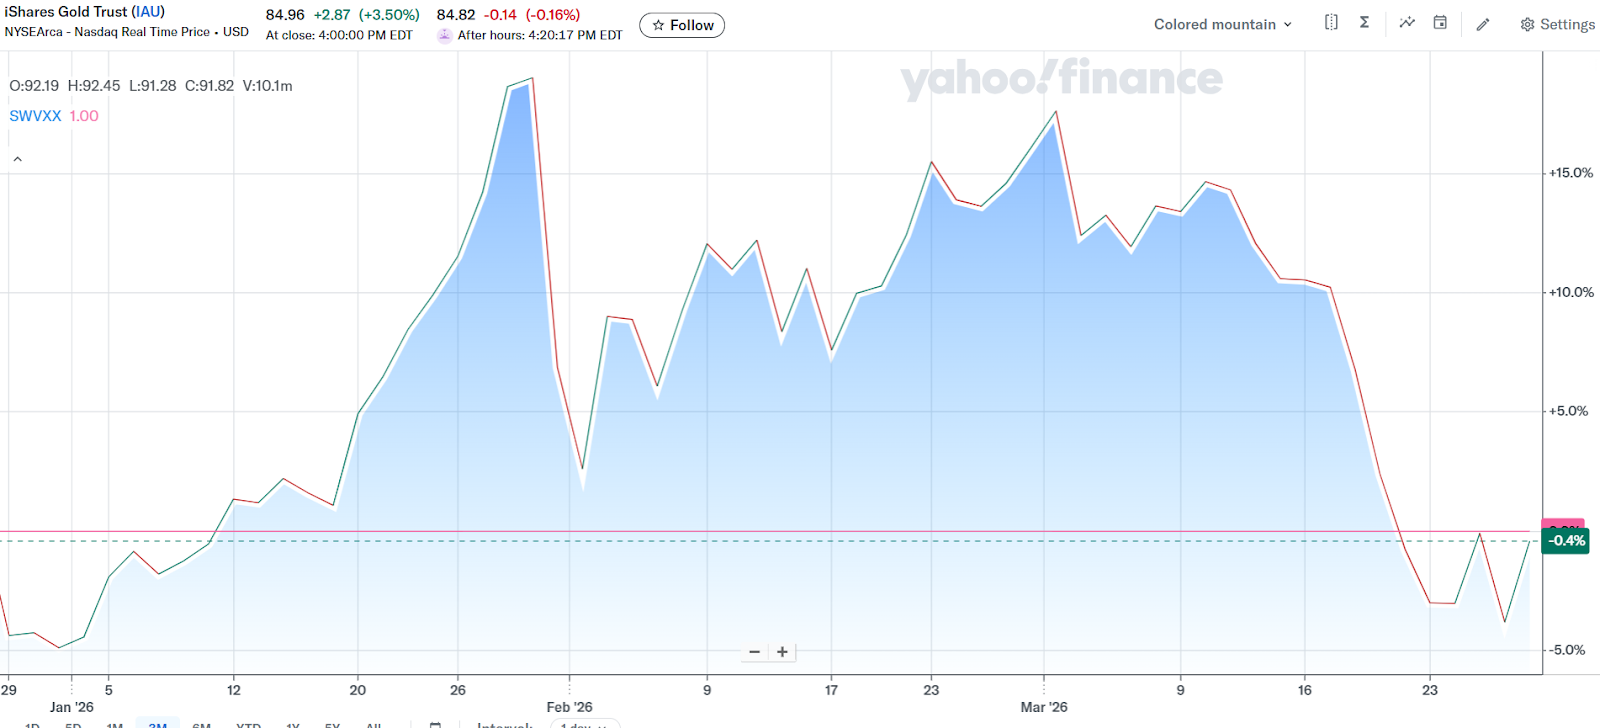
Yahoo! Finance: iShares Gold Trust (IAU), Schwab Value Advantage Money Fund (SWVXX), December 28, 2025-March 27, 2026
Stocks for 2036 and Beyond
With headlines dominated by the Iran conflict and energy price spike, the question that naturally pops up is: Is it time to sell? For investments held for 10+ years, history suggests a firm "no." Time has always been volatility’s kryptonite.
Let’s get in the wayback machine. Ten years ago in early 2016, the stock market was flailing, with the S&P 500 dropping nearly 15% and the Nasdaq within a whisker of a bear market. Investors were panicking. On February 8, 2016, a headline in the Wall Street Journal read, “Global Stocks Slide as Growth Fears Intensify; S&P 500 Hits 22-Month Low.”
Those who stayed the course and held their stocks when the S&P 500 was at 1,853 on February 8, 2016 have seen it recover to 6,367 on March 27, 2026 → a +243.5% return (not including dividends). Your investment more than tripled in just ten years.
While geopolitical headlines make the next week feel like a coin flip – maybe up, maybe down – I always like to zoom out to look at the historical "win rates" for the S&P 500 over longer time horizons:
Hold for a month: Stocks are up ~63% of the time.
Hold for a year: Stocks are up ~75% of the time.
Hold for 10+ years: Your odds of a positive return jump to well over 94%.
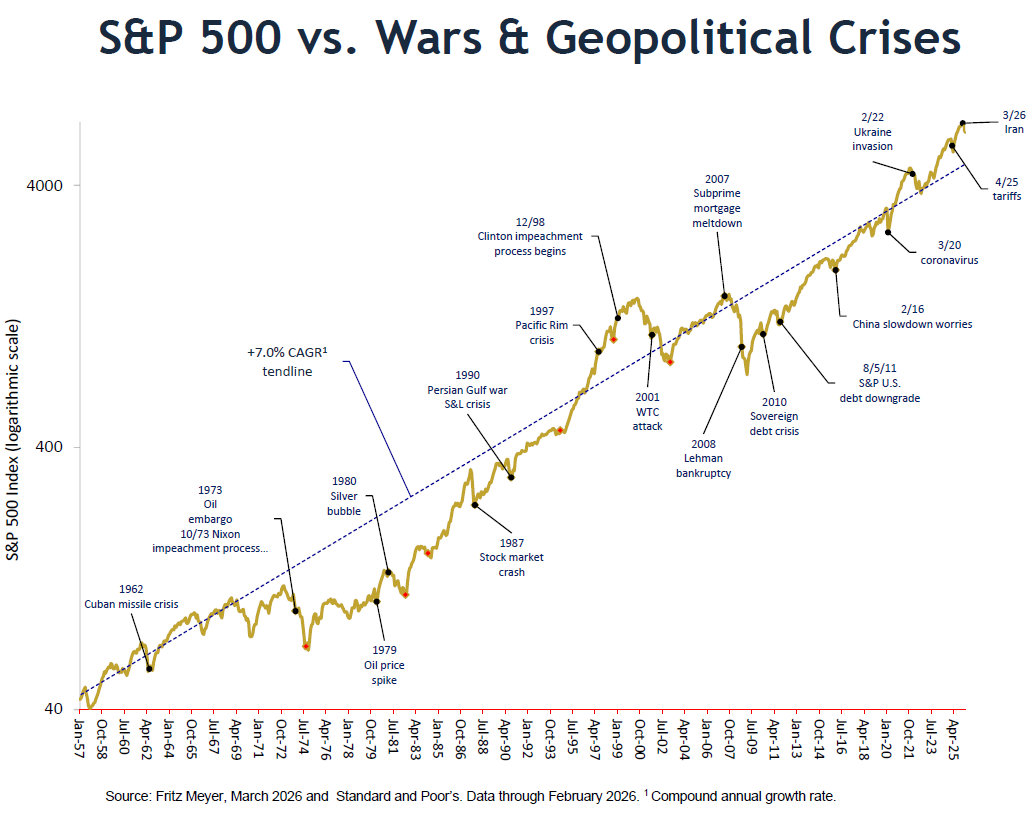
The market has a long track record of weathering storms, including the Cold War, 70’s inflation, and oil shocks of 1973 and 1990. If you’ve been a client for any length of time, you will not be surprised to see one of my all time favorite charts. Have very serious crises happened in the past? Has the market found a way to adapt? The answer to both is still “yes.”
Next Steps: Let’s Refine Your Plan Together
Navigating markets during a war is both an emotional and financial challenge. Down markets are very unpleasant.
Our most important job is ensuring your plan fits your current world. If you are feeling unsettled or want to stress-test your current cash reserves against long-term goals, please reach out. Our door is open, and we’re always happy to talk.